
free shipping at $99


The global jewelry industry is worth roughly USD 300–390 billion in 2025–2026, depending on which report you trust. Most credible forecasts point toward USD 500–650 billion by the early 2030s, but that rise won't necessarily mean consumers are buying more pieces.
That range is the first important answer to how much the jewelry industry is worth. The second is more revealing: published estimates differ by more than USD 139 billion for 2025, from USD 242.79 billion to USD 381.54 billion. The gap doesn't automatically mean one publisher is wrong. It usually means the reports are measuring different versions of the market.
The industry is also experiencing a price-versus-volume tension. One recent industry analysis reported that gross sales rose 4.7% while units sold fell 5.6%, a pattern that indicates higher prices and product mix, rather than stronger unit demand, can lift total revenue. JCK's coverage of jewelry retail in 2025 and 2026 highlights why a larger dollar market shouldn't be confused with more jewelry changing hands.
The most useful definition of jewelry industry value is annual global consumer revenue from finished jewelry sales. That means the money shoppers spend on completed rings, necklaces, bracelets, earrings, and related pieces, rather than the value of raw gold, uncut gemstones, or manufacturing activity before a product reaches a retailer.
That definition still leaves important choices. A report might include fine jewelry and fashion jewelry, while another focuses mainly on luxury products. Some models may include costume pieces, watches, lab-grown diamond jewelry, wholesale transactions, or broader accessories. Others may count only retail sales to end consumers.
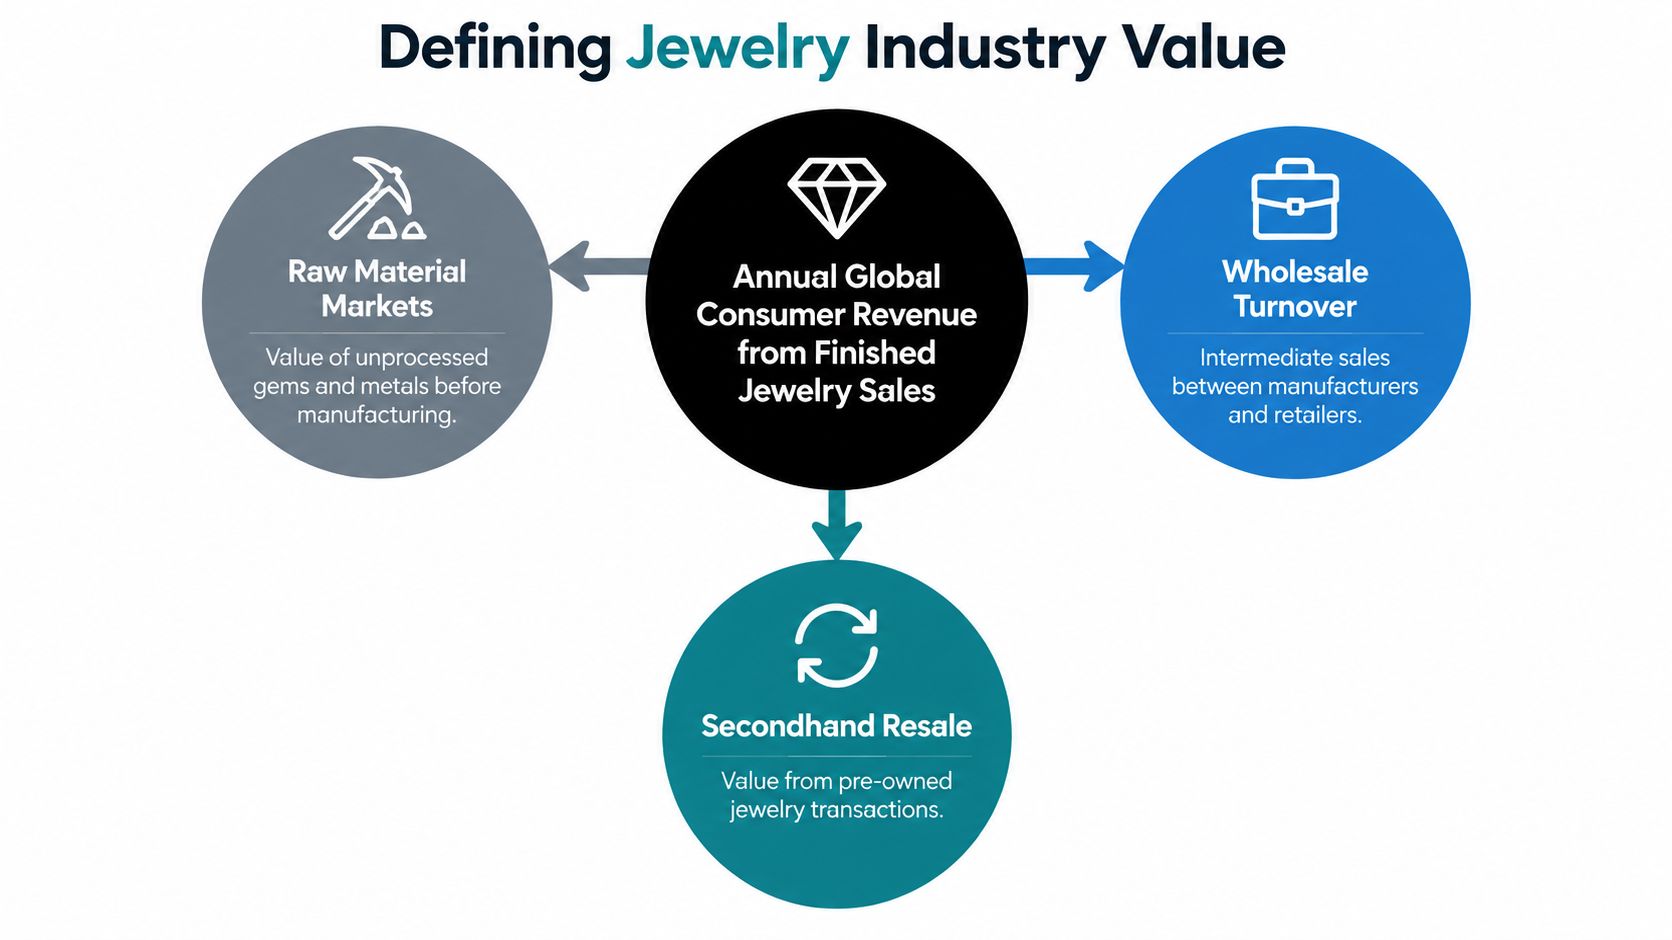
When someone asks what an industry is “worth,” they may mean one of three things:
This article uses market size and consumer spending as the primary measure. It doesn't attempt to add up the valuation of every jewelry company, because enterprise value depends on profit, debt, inventory, brand strength, and investor expectations rather than sales alone.
A further distinction matters for anyone trying to value an individual piece. The overall market's size provides context, but it doesn't determine what a particular ring or necklace is worth. Condition, metal purity, gemstone quality, brand, provenance, and resale demand all matter. A practical guide to how to value jewelry can help separate industry-level demand from item-level appraisal.
Currency conversion can also affect comparisons. A publisher may convert regional sales using exchange rates from a particular year, while another may use constant currency or current currency. B2B sales create another potential overlap, because the same piece can be counted as a manufacturer transaction and later as a consumer purchase if a methodology isn't designed to avoid double counting.
The right question isn't “Which number is correct?” It's, “What does this number include, and what does it leave out?” Without that answer, a precise-looking market estimate can create false confidence.
Published 2025 global jewelry-market estimates range from USD 242.79 billion to USD 381.54 billion. Fortune Business Insights places the market at USD 242.79 billion, while Grand View Research estimates USD 381.54 billion.
That gap is too wide to treat as rounding. It mainly reflects different market boundaries, including how reports classify fine jewelry, mass-market products, fashion jewelry, and related categories. The figures are more useful as a range than as inputs to an artificial average. They also show why dollar growth should not automatically be read as equivalent growth in units sold. Higher prices can raise revenue even when physical demand changes little.
| Publisher | 2024-2025 Estimate (USD) | Base Year | Scope Notes |
|---|---|---|---|
| Fortune Business Insights | USD 242.79 billion in 2025 | 2025 | Broad jewelry market estimate with a long-term forecast |
| Grand View Research | USD 381.54 billion in 2025 | 2025 | Global jewelry market estimate with finished jewelry included |
| IndexBox market overview | USD 310.3 billion or USD 368.5 billion for 2024, depending on model | 2024 | Demonstrates substantial variation across market overviews |
| IndexBox luxury jewelry estimate | USD 49.1 billion in 2024 | 2024 | Premium luxury-jewelry segment rather than the entire market |
IndexBox's 2024 jewelry market overview illustrates the disagreement from another angle. One model put 2024 revenue at USD 368.5 billion, up 2.4% from the prior year. Another reported USD 310.3 billion and described it as a 24% decline from the previous year. The same overview reported global consumption of about 43,000 tons and production of about 42,000 tons.
Those measurements cannot be combined without checking the methodology. Production weight, production value, retail revenue, and luxury sales describe different layers of the industry. The USD 49.1 billion luxury-jewelry estimate can sit alongside a total-market estimate above USD 300 billion because luxury jewelry represents only one part of the broader market.
The supplied evidence does not establish one 2026 figure that resolves these differences. The defensible conclusion is a market still measured in the low-to-high hundreds of billions, with the result determined by category coverage and valuation method.
Businesses should therefore build 2026 plans around the category they serve. A fine-jewelry brand, costume-jewelry marketplace, and lab-grown diamond retailer face different addressable markets, even when reports place them under the same industry label. The headline total provides scale, not a direct forecast of sales volume or company opportunity.
The total market becomes more useful after dividing it into price tier, occasion, material, and channel. Fine jewelry tends to carry more revenue per item because it uses higher-value metals and gemstones, while fashion and costume jewelry can generate substantial consumer reach through lower prices and faster assortment changes.
The verified data doesn't provide a reliable revenue-share split for fine jewelry, fashion jewelry, gold, diamonds, silver, platinum, gemstones, or lab-grown diamonds. It would therefore be misleading to assign each category a precise percentage of the global total. The safest conclusion is qualitative: the fine-versus-fashion boundary is one of the biggest reasons market estimates diverge.
| Segment | Estimated Revenue Share | Notes |
|---|---|---|
| Fine jewelry | Not specified in the verified data | Higher-value products, often involving precious metals and gemstones |
| Fashion and costume jewelry | Not specified in the verified data | Broader accessibility and lower average price points |
| Bridal jewelry | Not specified in the verified data | Demand is tied to engagement, wedding, and anniversary purchases |
| Self-purchase jewelry | Not specified in the verified data | Reflects individual discretionary buying rather than gifting |
| Online sales | Not specified in the verified data | Digital discovery and transaction channel |
| In-store sales | Not specified in the verified data | Physical retail, appointments, and assisted selling |
| Gold jewelry | Not specified in the verified data | Its dollar value is sensitive to metal prices |
| Diamond jewelry | Not specified in the verified data | Natural and lab-grown products can have different pricing dynamics |
| Silver, platinum, and colored gemstones | Not specified in the verified data | Distinct supply, price, and consumer-demand characteristics |
Material also changes the meaning of revenue growth. If gold becomes more expensive, a similar number of gold items can generate more sales dollars. That doesn't prove that shoppers are buying more metal by weight.
The distinction between metal content and purity matters at the product level as well. For example, what 14K means on jewelry helps explain why two pieces that look similar can contain different proportions of gold and carry different pricing.
Lab-grown diamonds add another methodological challenge because they can change the product mix and average selling price within diamond jewelry. The verified evidence identifies lab-grown diamonds as a factor reshaping the market, but it doesn't provide a verified global revenue share for them.
That limitation matters. A report that includes lab-grown diamond jewelry may capture more units at different price points than a report concentrated on natural diamond or luxury jewelry. Segment analysis should therefore identify not only what materials are present, but also how the report treats alternatives within the same material category.
Published estimates do not describe one stable market total. For 2024, the available figures range from USD 310.3 billion to USD 368.5 billion. For 2025, they range from USD 242.79 billion to USD 381.54 billion. The spread reflects differences in category coverage, valuation methods, and the point in the supply chain being measured.
A precise year-by-year growth arc from 2018 through 2023 cannot be verified from the supplied evidence. The broader pattern is clearer: jewelry combines gifting, fashion, luxury, precious metals, diamonds, and lower-cost accessories. Those categories face different demand, pricing, and production conditions, so their revenues do not move together.
The available production data indicate substantial global scale. In 2024, reported consumption was about 43,000 tons, while production was about 42,000 tons. The same overview cited production value of USD 394.5 billion and identified China, the United States, and India among the leading markets or producers. These figures help show the industry's manufacturing and consumption reach, but they are not a consistent retail-sales series for measuring annual growth.
Luxury jewelry follows a separate growth path. Its estimated value was USD 49.1 billion in 2024, with a forecast of USD 82.1 billion by 2030 and a compound annual growth rate of 8.7%, according to the previously cited IndexBox analysis. A premium segment can therefore expand faster than the broader market without implying equivalent growth across mass-market jewelry.
An increase in market value can come from higher prices, more units sold, a shift toward expensive products, or broader category coverage. Matching definitions across years is necessary before treating the change as underlying industry growth.
The most defensible conclusion is that the industry became large through a combination of scale, product breadth, and price effects. Its history is expansive but uneven, and the published totals should be compared as estimates shaped by methodology, not as a perfectly measured annual progression.
Revenue growth and unit growth can move in opposite directions. The supplied evidence reports that gross sales rose 4.7% while units sold fell 5.6% over the year. The retail analysis previously cited links this pattern to higher gold prices, tariffs, inflation, changing entry-level price points, and shifting demand for natural and lab-grown diamonds.
A useful decomposition is:
Revenue change = volume effect + price effect + mix effect.
The volume effect measures the number of pieces purchased. The price effect reflects higher prices for comparable items. The mix effect emerges when consumers buy fewer low-priced products but allocate more spending to higher-priced gold, branded, bridal, or gemstone pieces.
A shopper who replaces several inexpensive purchases with one higher-ticket item gives the retailer more revenue from fewer pieces. Across the industry, that pattern can make demand look healthier than unit sales indicate.
Material costs reinforce the effect. Gold-price increases raise the cost of gold jewelry, and retailers may pass part of that increase to customers. Tariffs and operating expenses can push ticket prices higher as well. Consumers may remain interested in jewelry while postponing entry-level purchases, buying less often, or choosing simpler designs and materials.
The result is a nominally larger market with weaker or uneven underlying volume.
Analyst's rule: Treat a rising revenue line as incomplete evidence until you know what happened to units, average selling price, and product mix.
Dollar value remains commercially meaningful, but it does not measure affordability or purchase frequency. A market can report higher revenue while shoppers face higher entry prices and purchase fewer pieces.
The published USD 242–382 billion estimates for 2025 illustrate the issue. Their spread reflects differences in market definitions and methodology, while recent dollar growth can also reflect inflation and product mix rather than more units sold. These figures should therefore be read as measures of spending value, not as a direct count of jewelry demand.
The more cautious conclusion is that premiumization and price inflation are supporting revenue while consumer volume can remain flat or decline. Natural diamonds, lab-grown diamonds, bridal jewelry, and fashion jewelry may consequently produce different results at the same time. Strength in one tier can offset weakness in another without creating broad-based unit growth.
Published 2025 forecasts range from USD 242.79 billion to USD 381.54 billion. That spread is not a minor rounding difference. It reflects different market boundaries, included product categories, and measurement methods, so the projected endpoint must be read alongside the starting definition.
The broadest documented model estimates USD 381.54 billion in 2025 and projects USD 578.45 billion by 2033, implying a 5.5% compound annual growth rate from 2026 to 2033. The same research provider also presents an alternative model with USD 389.13 billion in 2024 and USD 649.51 billion by 2034. These figures should not be merged, because they describe different frameworks.
A narrower model starts at USD 242.79 billion in 2025 and forecasts USD 387.36 billion by 2034, at a 5.41% compound annual growth rate. Its growth rate is close to the first model's, but its lower base creates a substantially lower terminal value.
| Model | Base Year Value (USD B) | Forecast Year Value (USD B) | Implied CAGR | Key Assumption |
|---|---|---|---|---|
| Broad market model one | 381.54 | 578.45 by 2033 | 5.5% from 2026 to 2033 | Broad market scope and continued expansion |
| Broad market model two | 389.13 in 2024 | 649.51 by 2034 | Not specified in the verified data | Alternative market definition and forecast framework |
| Narrower market model | 242.79 | 387.36 by 2034 | 5.41% | Different market boundary and measurement approach |
The reasonable conclusion is directional: the industry could reach the high hundreds of billions within the next decade. The evidence does not support treating USD 500–650 billion as a universal outcome. One documented model reaches that upper band, while another remains below USD 400 billion by 2034.
Forecasts also describe revenue, not necessarily the number of pieces sold. They incorporate assumptions about consumer spending, precious-metal prices, product mix, and geographic demand. Since recent dollar growth can reflect inflation and premium products, a rising projection should not be interpreted as equivalent unit growth.
A jewelry resale value guide helps assess products in secondary transactions, but resale value should not be added automatically to primary-market revenue. Counting both can record the same object across separate transactions.
Published 2025 estimates span roughly USD 242 billion to USD 382 billion. That spread is not a minor forecasting error. It reflects different market boundaries, including whether a source counts fine jewelry, fashion jewelry, watches, lab-grown diamonds, wholesale activity, or resale. A headline figure without its definition can therefore mislead.
The first misconception is that jewelry forms one homogeneous market. Fine jewelry, fashion jewelry, luxury pieces, bridal products, and lab-grown diamond items have different prices, buyers, supply chains, and demand cycles. Luxury jewelry alone was estimated at USD 49.1 billion in 2024, while broad total-market estimates for the same period exceeded USD 300 billion. The categories are not interchangeable.
The second misconception is that a higher market value always means more pieces sold. Revenue can increase while unit demand falls, particularly when gold prices, tariffs, inflation, and premiumization raise average ticket prices. One recent retail comparison recorded gross sales rising 4.7% while units sold declined 5.6%, a gap that separates price growth from volume growth.
A third misconception is that published market estimates describe a single, stable history. The available 2024 overviews reported sharply different results, including USD 368.5 billion with a 2.4% increase and USD 310.3 billion with a 24% decline. Those figures should not be combined into one trend line. They show why analysts need to check scope, currency treatment, coverage, and methodology before comparing estimates.
Affordability is a separate question from market size. If higher metal and operating costs lift the price of finished jewelry, shoppers may spend more per transaction while purchasing fewer items. The total dollar value can rise even as entry-level customers find the category less accessible.
A market-size estimate measures reported economic activity within a defined boundary. It does not value every jewelry item or business.
For investors, retailers, and shoppers asking how much is the jewelry industry worth, the defensible answer includes a range, a definition, and a price-volume caveat. Use the headline figure to understand scale, then use segment-specific data to assess demand and affordability.
Jackpot Candles sells scented candles and bath bombs containing a surprise jewelry item. Its appraisal page lets customers enter a code to check the hidden item's value. Visit Jackpot Candles to explore products linking product discovery with jewelry valuation.
Comments will be approved before showing up.