
free shipping at $99


If you’re aiming for a quick lift in your average order value, layering bundles, upsells, cross-sells and free shipping thresholds is your most direct route. In our work with candle and jewelry-surprise brands, these tweaks can deliver a 10–30% uplift in just a few weeks.
Here’s what’s driven real gains for merchants like Jackpot Candles:
Sometimes the smallest wording changes have the biggest impact. A few smart copy adjustments and banner placements can lift AOV without overwhelming your design.
These tweaks keep the checkout flow smooth and highlight savings at every turn.
Introducing subscription options or loyalty rewards can encourage higher upfront spend and regular returns. When paired with bundles and upsells, they amplify average basket totals over time.
Pairing these hooks with product bundles layers multiple incentives into one seamless checkout journey.
Below is a quick look at the average AOV lift you can expect from each tactic. This snapshot helps prioritize which experiments to run first.
| Strategy | AOV Lift |
|---|---|
| Bundles | 15–25% |
| Upsells | 10–20% |
| Cross-Sells | 8–12% |
| Free Shipping Thresholds | 5–10% |
| Tiered Pricing | 12–18% |
| Limited-Edition Offers | 7–14% |
Starting with bundles and upsells usually delivers the fastest wins. From there, you can layer in messaging tweaks, loyalty hooks, and other strategies to hit the upper end of your growth targets.
Key Insight: Bundles spark an immediate jump in AOV, but the real magic happens when you combine multiple tactics in a single checkout path.
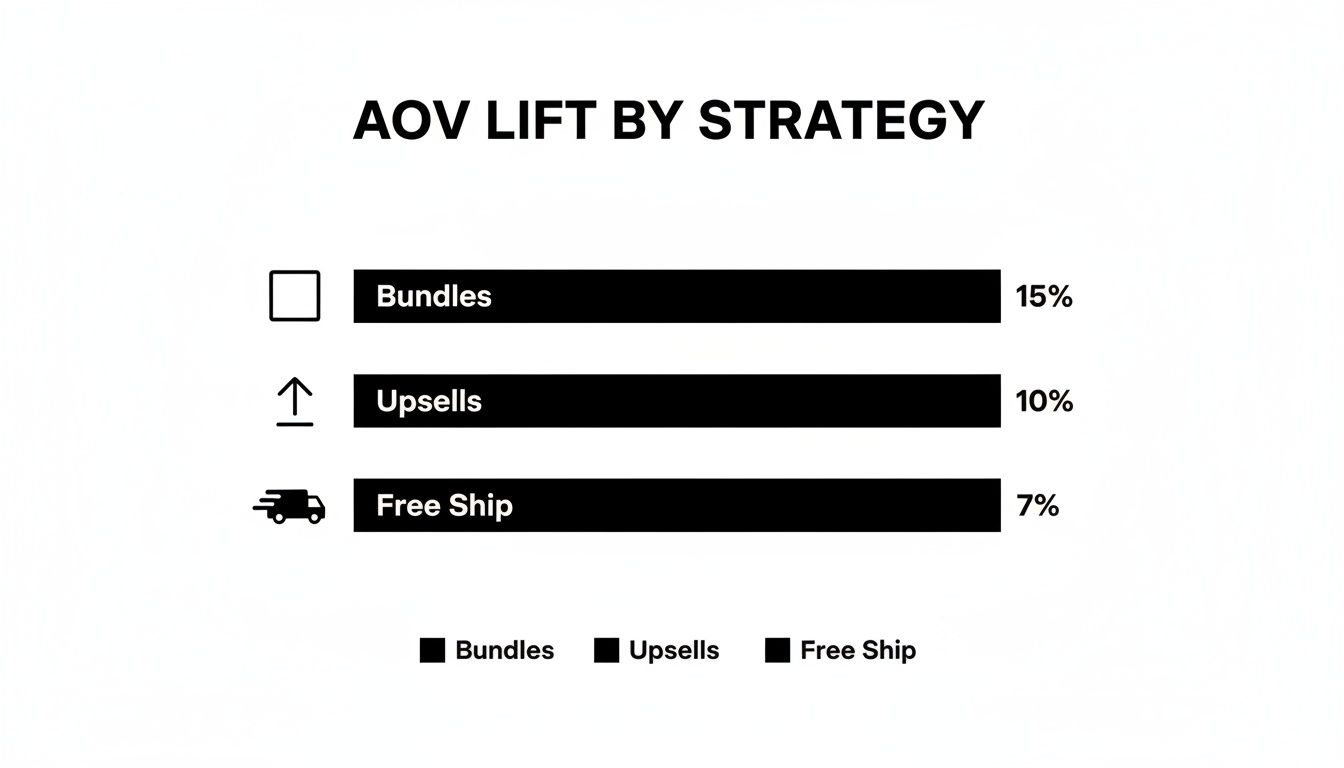
There’s a noticeable gap in impact across different tactics. The infographic below breaks down the average lift percentages for each strategy:
Loyalty incentives and subtle copywriting cues—like framing savings in dollar amounts rather than percentages—build on these tactics to push your metrics even higher.
To refine conversion tactics alongside AOV growth, check out our guide on improving e-commerce conversion rates.
When shoppers see a candle and bath bomb paired with a hidden piece of jewelry, they often add both to their cart. That simple nudge shows how cross-category interest can lift your Average Order Value (AOV).
Standalone e-commerce sites frequently outpace big marketplaces, posting 2–3x higher order values. It’s not magic—pinpointing what motivates customers and setting smart AOV targets gives you the edge.
Browsers presented with complementary items click more and spend more. A home decor retailer, for instance, boosted cart totals by 20% simply by bundling wax melts with candles.
Jewelry-surprise fans behave similarly. Once they glimpse that hidden ring, they often tack on jewelry care products or gift sets. Key behaviors include:
“Bundling smartly is the low-hanging fruit for AOV growth,” says a VP of Merch at a leading fashion retailer.
These patterns lay the groundwork for picking the right tactics.
Rising material and fragrance costs naturally push prices—and AOV—upward. At the same time, brand loyalty keeps customers willing to pay a premium for trusted experiences and that extra thrill of surprise jewelry.
In 2024, global e-commerce AOV hit $144, marking the fourth year of consecutive growth and a 30% rise since 2019. For deeper benchmarks, check SpeedCommerce’s Global AOV Insights.
Here’s a quick look at how the global average order value has climbed over the past five years:
Table: AOV Growth Over Time
| Year | Global AOV | Growth Since 2019 |
|---|---|---|
| 2019 | $110 | — |
| 2020 | $120 | 9% |
| 2021 | $130 | 18% |
| 2022 | $135 | 23% |
| 2023 | $140 | 27% |
| 2024 | $144 | 30% |
Seeing these figures side by side helps you benchmark your own targets and tactics.
Dive into your analytics dashboard to spot category spikes. You might see home decor candles jump 15% in AOV after launching a themed bundle.
Monitor shipping thresholds closely. When free-shipping bars move 10% above your baseline AOV, order values climb almost immediately.
Keep an eye on:
Numbers reveal where upsells or cross-sells are most potent.
Key Insight Standalone brand sites often record twice the AOV of marketplaces. Prioritize your owned channels first.
When you control the entire shopping journey—from homepage to checkout—you can tweak messaging, bundling, and thresholds in real time.
Consider these tactics:
These features reduce friction and keep customers exploring longer. No wonder standalone sites can see up to 3x higher AOV than big marketplaces.
Next up, we’ll map out practical test ideas and KPI tracking methods to turn these insights into measurable growth.
Bundling and upselling are two of the simplest ways to bump AOV in your store. At Jackpot Candles, pairing our signature candles with wax melts or jewelry care kits lifted average carts by 30%—all without feeling salesy. The magic happens when price anchors and smart placement guide a customer’s eye.
Imagine a bestselling candle matched with a wax melt version of the same scent. The cohesion makes the bundle feel like a thoughtfully curated duo.
Jewelry care kits slip in naturally next to ring reveal candles. When items “belong” together, customers click Add More without a second thought.
Toss in a modest bundle discount, show solo prices first, then reveal the package deal. That contrast makes the savings feel too good to pass up.
An upsell should read as friendly advice, not a hard sell. On product pages, slot a fragrance upgrade right beneath the Add to Cart button.
After checkout, a post-purchase prompt can spark one more click. These little nudges routinely drive 10-20% lifts in average order value.
Strategic product bundling and upsell tactics have proven to be powerhouse strategies for increasing average order value, with effective implementations boosting AOV by 10-30% across global e-commerce stores. Discover more insights about AOV strategies on OpenSend
Where you position an offer makes all the difference. Trigger an order bump as soon as someone scrolls past your product images. Or slot premium packages in the cart sidebar, where they’re visible but not overwhelming.
Test different moments and layouts:
Split-tests will reveal if desktop shoppers respond best to a sidebar nudge, while mobile users prefer inline prompts.
This widget shows clear calls to action and bold pricing that pull the eye. When visuals align with your brand, add-on rates can climb by up to 25%.
You might be interested in exploring how candle sets enhance gift giving. Check out our guide on candle gift sets for bundle inspiration Check out our guide on candle gift sets
Offer only a couple of curated bundles per view to keep choices simple. Write copy that highlights how each add-on solves a problem or creates a moment of delight.
“Small bundle tweaks can move the needle on AOV dramatically.”
Planning your first experiments? Try these variations:
Capture attach rate, conversion, and uplift by device. Survey customers post-purchase to unlock qualitative feedback. Document every hypothesis and share results with your team.
Schedule weekly and monthly reviews of your key metrics. Watch for changes in attach rates, AOV, and overall conversion.
Generate channel-specific reports to see where bundles resonate most. Then loop in marketing and product teams to align on promotions. Continuous tweaks based on real data will keep those bundles profitable and your customers happy.
A well-placed free shipping bar often nudges customers to toss in one more item. When you set that sweet spot just above your current average order, the target feels doable.
Data from online retailers shows a 10% bump above your Average Order Value (AOV) can deliver double-digit growth. One fashion brand watched carts climb over the line and saw a 12% boost in just seven days.
Buy-Now-Pay-Later options like Klarna break up payment into bite-sized pieces. This makes premium bundles more accessible and often pushes cart totals higher.
Free shipping thresholds combined with BNPL are quietly reshaping AOV. Global e-commerce averages climbed to $144.57 by November 2024. Learn more about this trend on BestColorfulSocks.
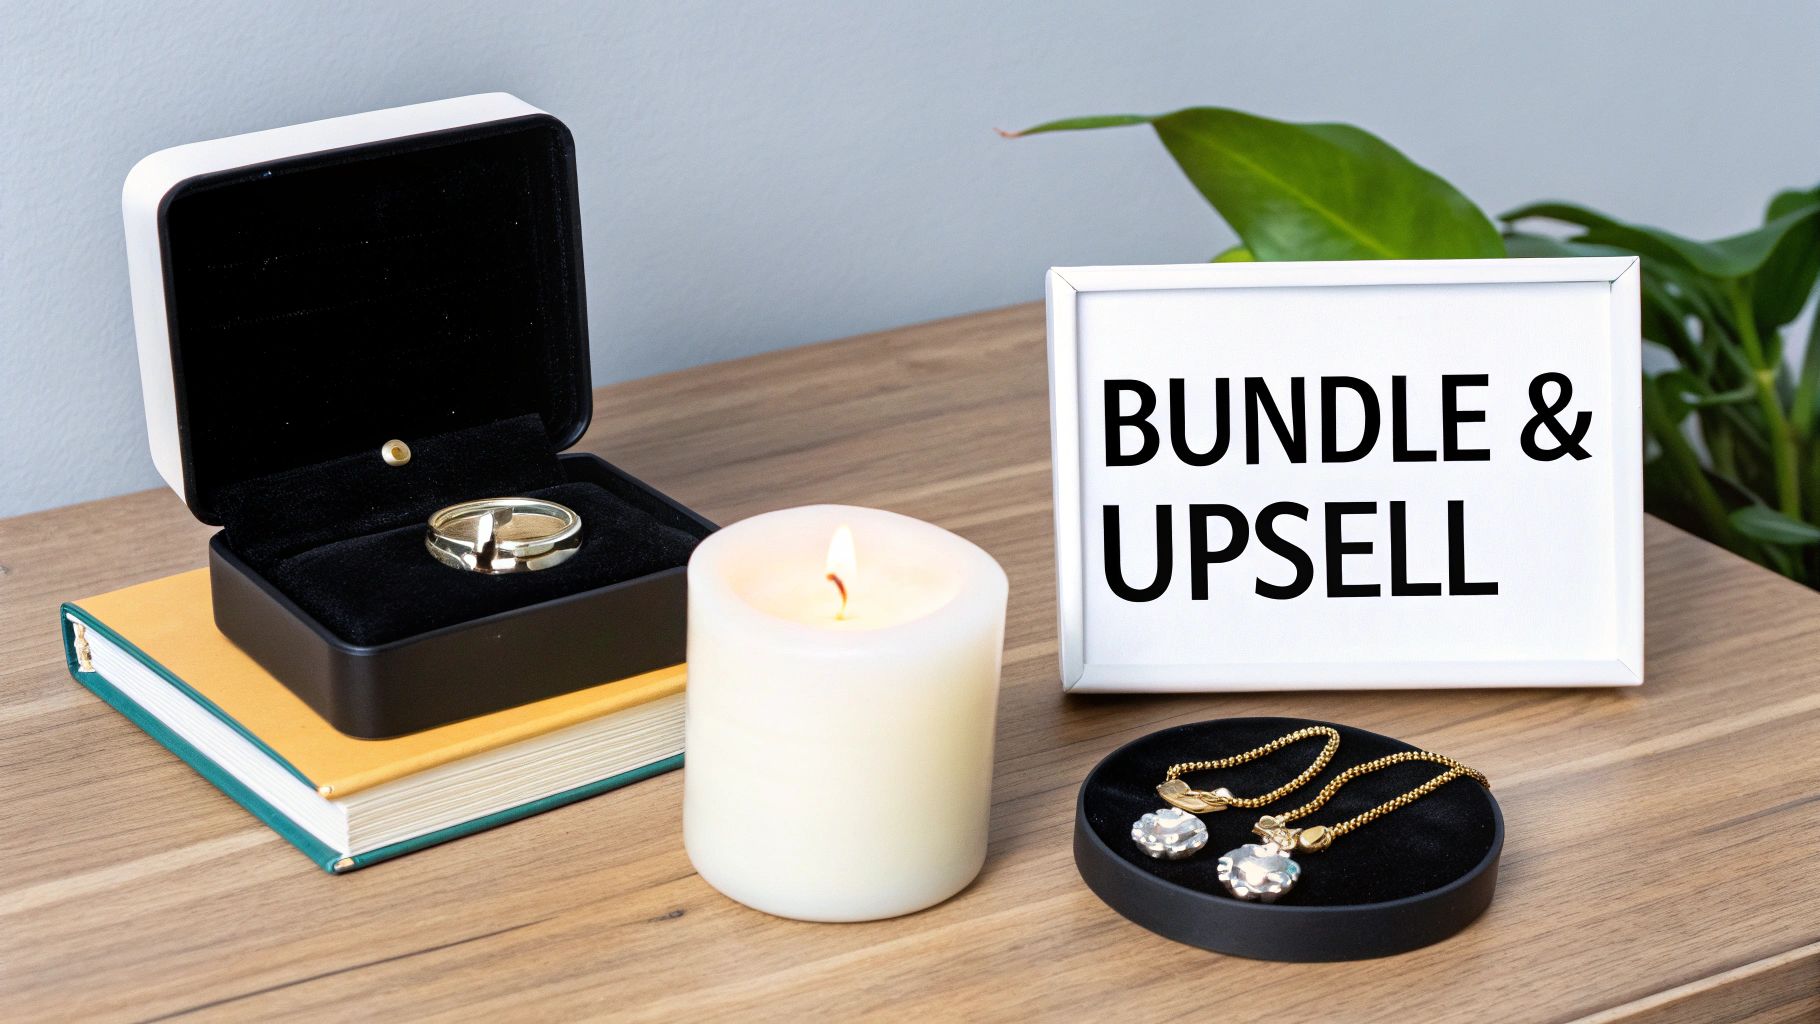
Stores that layer both incentives saw AOV climb nearly 15% in Q3 alone.
Smart banners and cart alerts turn a free-shipping offer into a reward. A simple message like Free Shipping Over $60 catches attention right before checkout.
Adding a payment badge—think Klarna’s logo—signals flexibility at checkout. Displaying financing options can unlock a 20% lift in high-ticket purchases.
Emphasize payment flexibility to encourage larger purchases and build trust at checkout.
Before you roll out a new threshold, model the cost impact. If shipping runs you $5 per order, a free-ship offer might trim 3–7% off your margin.
Track both the basket lift and margin change side by side for a full picture. Check out our guide on premium pricing strategy examples for deeper insights.
This table breaks down how different thresholds can affect your metrics:
| Threshold Increase | Expected AOV Lift | Margin Impact |
|---|---|---|
| +5% | 4–6% | 1–2% |
| +10% | 8–12% | 3–5% |
| +15% | 12–18% | 5–7% |
Constant measurement and tweaking keep both customers and margins happy.
A/B testing thresholds and financing options reveals what truly moves your average order value.
Jot down your free shipping goal and chosen financing options on a single page. Share the plan with your team and revisit results every two weeks.
Document each experiment so the strategies that work become repeatable best practices.
Start running your first test today and watch your candle and jewelry surprise store flourish.

Cut friction right before checkout with the right nudge. Small tweaks to wording and timing can spark big jumps in attach rates and cart size. Below, you’ll see how inline recommendations, pop-ups and cart prompts helped us boost attach rates by 15%.
Remember when Jackpot Candles rolled out reminder bars about free shipping and bundle deals? Placed at the top of the checkout, they casually suggested adding a bath bomb or jewelry care kit. Guess what—cross-sell conversions climbed noticeably in under a week.
Just under your product description, slot in a carousel that pulls in related favorites.
This feels seamless and keeps shoppers locked into the product page. We’ve even swapped placement—below the add-to-cart button versus above the related section—and found some shoppers only click after they’ve scrolled halfway down.
“Small changes in placement can drive big performance shifts,” a seasoned marketer once told us.
Timing is everything. A pop-up fired after a three-second pause can feel like a helpful hint, not an annoyance. Try headlines such as “Complete Your Scented Set” or “Add Jewelry Cleaner For $5.”
Key touches:
In our tests, these pop-ups drove up to 15% more cross-sells when paired with limited-time bundle messaging.
Your cart page still has plenty of room to lift AOV. Consider these moves:
And a few more tweaks:
Fine-tuning copy comes down to testing. Here’s what we found when comparing three variants:
| Variant | Outcome |
|---|---|
| Control: “Add Jewelry Care Kit” | No change |
| “Complete Your Care Routine For $5” | 12% attach-rate lift |
| “Don’t Forget Your Jewelry Cleaner Bundle” | 15% attach-rate gain |
Swap button text between “Add To Cart” and “Yes Please,” and run tests on mobile and desktop. Small word swaps uncover big wins.
Wrap your findings into a single dashboard. Watch attach rate, conversion and overall AOV. Note which audience segments reacted best.
Key Takeaway: When you blend inline carousels, well-timed pop-ups and cart prompts—and keep testing—you’ll see cross-sell attach rates climb and average order value rise.
In one run, a reminder bar stating “Bundle And Save $10” lifted add-on purchases by 18%. A mobile pop-up with a free shipping countdown added 9% to cart value. Another test slipped an inline note under candles—“Don’t Miss Your Surprise Jewelry”—and saw a 7% uptick in clicks. These are the small copy tweaks that stack up to meaningful AOV gains. Try similar widgets, tailored for Jackpot Candles, to hit your own targets.
Implement these tactics and watch your average order value climb consistently.
You can’t crank up your Average Order Value without knowing where you stand. That’s why tracking and testing become your best friends. In this section, we’ll break down the must-watch figures, show you how to hook into Shopify and Google Analytics, and map out A/B tests that move the needle.
Start by zeroing in on Average Order Value (AOV). It’s simply your total revenue divided by the number of orders—and it’s your north star.
Next, keep an eye on Attach Rate, which tells you how often customers take that extras offer you’ve set up—think bundles, upsells, or cross-sells. Then there’s Conversion Lift, the percentage change in conversion rate after you tweak your pages or offers.
Getting the data right means tapping into both Shopify’s reports and Google Analytics.
On Shopify:
On Google Analytics:
Tracking across platforms gives you a 360° view—no surprises lurking in the shadows.
A clear A/B test framework keeps you from wandering off course. Here’s how you can structure yours:
It’s tempting to rush tests, but proper sample sizes and clear hypotheses save you from reinventing the wheel.
Numbers tell only half the story. Pair your quantitative lift with qualitative feedback—think post-purchase surveys or on-site chat transcripts. Did AOV climb but attach rate linger? Experiment with your copy or adjust price anchors.
| Metric | Control Group | Variant Group | Lift |
|---|---|---|---|
| AOV | $45.00 | $50.00 | 11% |
| Attach Rate | 12% | 16% | 4pt |
| Conversion Lift | — | 6.5% | 6.5% |
Jackpot Candles bumped their free-shipping threshold and saw attach rate jump from 8% to 13%, pushing overall AOV up by 9% within two weeks.
Consistent testing and tracking mean you’re always refining your offers—so your AOV keeps climbing.
Set a weekly check-in. Flag any unexpected dips or spikes. Then loop in your product and marketing teams to turn insights into action.
Now that you’ve got your data pipeline and test framework running, here’s what to tackle next:
By making measurement part of your daily routine, A/B testing evolves into a feedback loop that powers growth.
Cultivating a testing culture across teams takes patience, but pays dividends:
Growth isn’t a one-and-done deal. It’s the sum of small, continuous improvements powered by data and creativity.
Tired of guessing how to nudge shoppers toward bigger carts? Below you’ll find concise solutions to the most common AOV headaches—plus quick warnings on pitfalls that trip up even seasoned e-commerce teams.
How Do I Pick The Right Free Shipping Threshold?
You want it slightly out of reach—but not so far that it feels impossible. Aim for about 10–15% above your current AOV. A small push, one extra item, and you’ve got another sale.
Where’s The Sweet Spot For Upsells?
Don’t wait until checkout. A gentle nudge on the product page can work wonders, followed by timely in-cart suggestions and exclusive post-purchase deals.
How Can I Raise AOV Without Killing Conversions?
Keep an eye on AOV and conversion rates side by side. Spot a dip? Tweak your price anchors or refine your messaging, then retest quickly.
What’s The Easiest Way To Test Bundles?
Split your audience. Show bundles to half your visitors, hide them from the rest, and track AOV plus attach rates over two weeks. Let the data decide the winner.
Any Pro Tips For Gift Sets?
Group candles and jewelry by theme, offer tiered discounts, and highlight individual item values versus the bundle price. Rotate themes each season to keep customers coming back.
You’ve got to treat these metrics as equals. If you push too hard on AOV, conversions can slip. Dial back the discount or bump size until you find your groove.
Small adjustments often deliver the biggest improvements.
Track attach rate, conversion lift, and direct customer feedback in a shared space. That way, every test becomes a learning opportunity for your entire team.
Ready to elevate your average order value with surprise jewelry candles? Shop Jackpot Candles
Comments will be approved before showing up.